FAQs
In Expana platform, FeedInfo users will be provided with access to the News & insights module, however the access to content within that module will be dependent on your organisation’s subscription.
News
Will contain short articles which relate to our benchmark price (EBP) offering. You’ll also see these alongside a price chart if you view via Prices & forecasts, e.g. for Methionine Solid DDP NW Europe:
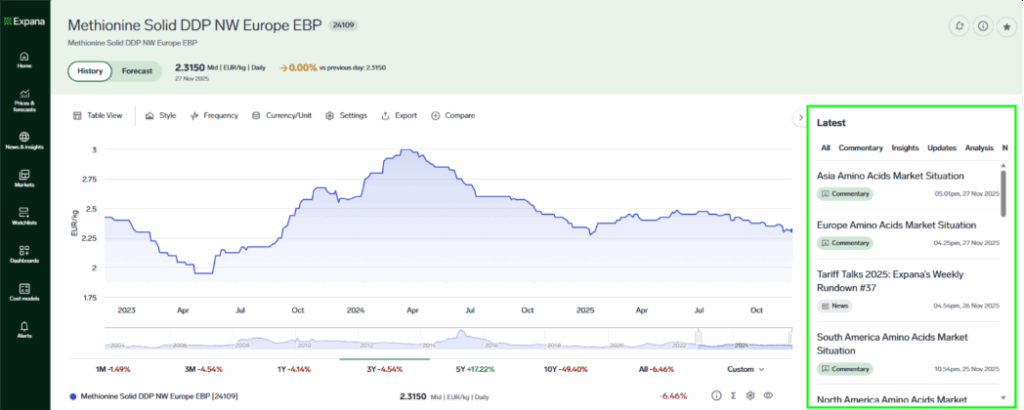
You will note that articles are tagged with either ‘commentary’, ‘news’ or ‘analysis’.
Back in the News section, you can select by category to narrow down what is shown:

Insights
Will contain something new for FeedInfo users; long-form PDF reports for the categories available to FeedInfo subscribers, including monthly market insight reports for Global Amino Acids, Global Vitamins, Global Minerals and Aquafeed.
Plus, monthly market insights for: Base metals, Steel, Sustainable Packaging Materials and Global and regional Packaging materials.
These reports will combine existing news and commentary insights together with supply and demand analysis by our expert market reporters, an indication of market sentiment for the reporting month and provide a deeper analysis to benefit platform users.
Once a user clicks into the Insights section, you can select by category to narrow down what is shown:
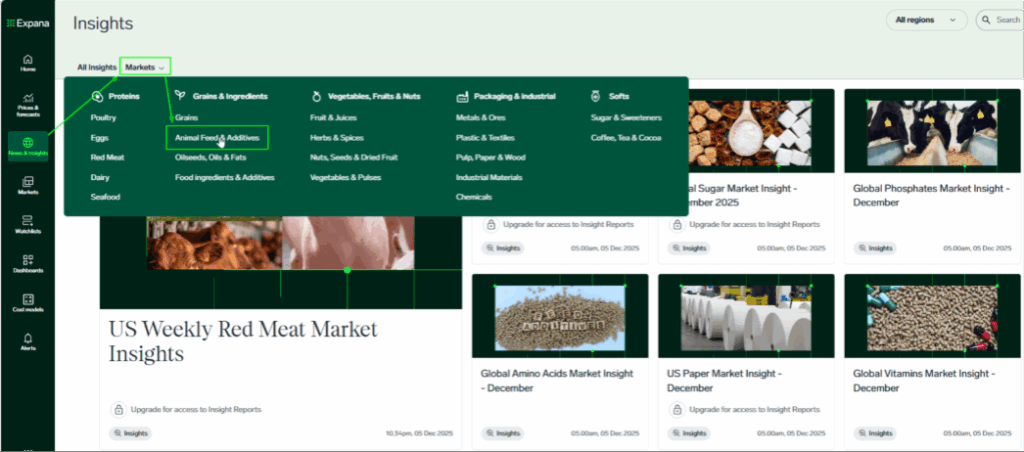
Anything not included in your company’s subscription will show a padlock symbol and you can speak to your Client Success Team via [email protected] to find out more.
Yes. In addition to pricing, the API includes production figures, export/import statistics, economic indicators, forecasts, and proprietary market news and commentary.
Absolutely. The Expana API includes built-in conversion features for currencies, units, and frequencies, allowing you to retrieve data in the format that best suits your needs.
Update frequency varies by series – daily, weekly, monthly, quarterly, semi-annually, or annually – so you receive the most relevant and timely information depending on the dataset.
Simply request access on this page and a member of our sales team will provide the full technical documentation, including the data model, available endpoints, and example usage.
The Expana API is a standard RESTful API designed for seamless integration with any system that supports REST. Its simple, intuitive structure makes connecting and customizing the API to fit your data platform quick and hassle-free.
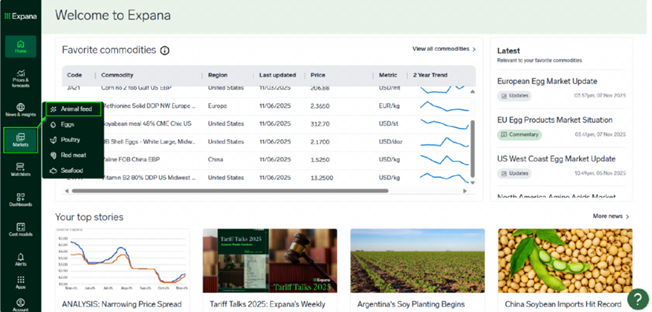
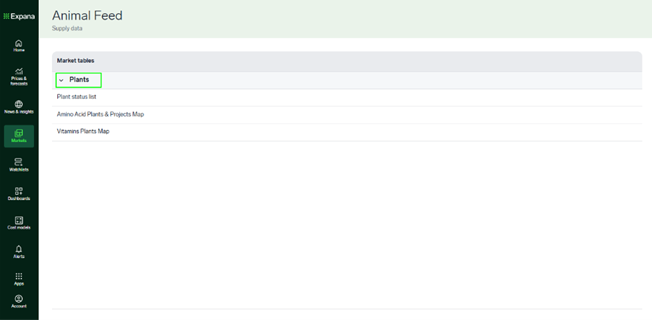
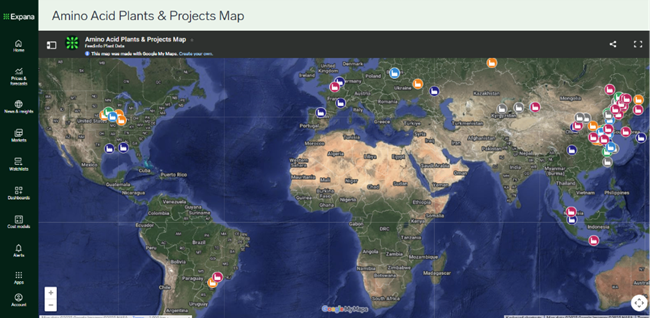
In Expana platform this information can be found under Markets > Animal Feed. You’ll see information presented as a list with collapsible sections, and can click into e.g. Plants > Amino Acid Plants & Projects Map to find the same information as is available in FeedInfo platform.
1.
2.
3.
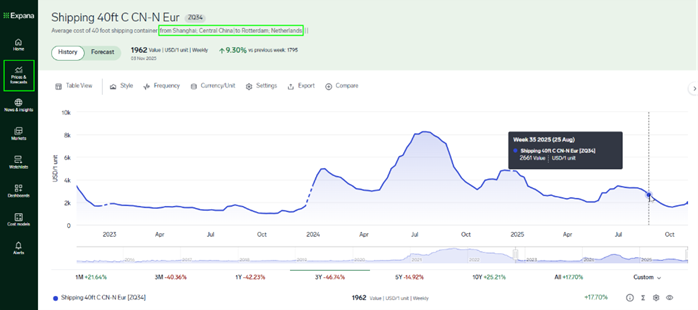
In Expana platform this information can be found under Prices & forecasts. for example if you’re looking for a major route like Shanghai – Rotterdam (see image for FeedInfo view)

You can search “Shanghai Rotterdam” in Prices & Forecasts (or on the onboarding page where you choose your favourites).
From the search results you’ll see the most relevant series to your search at the top of the list, and anything not included in your subscription will greyed out with a lock symbol. This should help you to narrow down.

For any help needed with finding freight rates you usually track, please contact your Client Success Team via our Contact Form
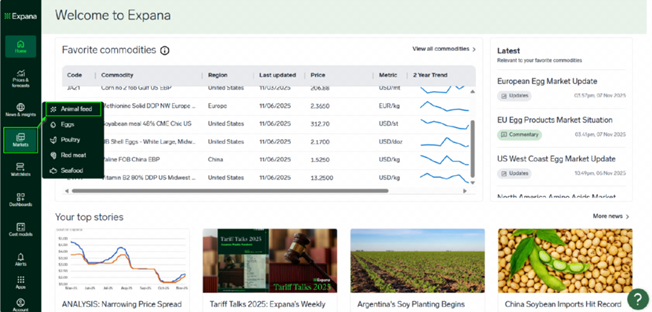
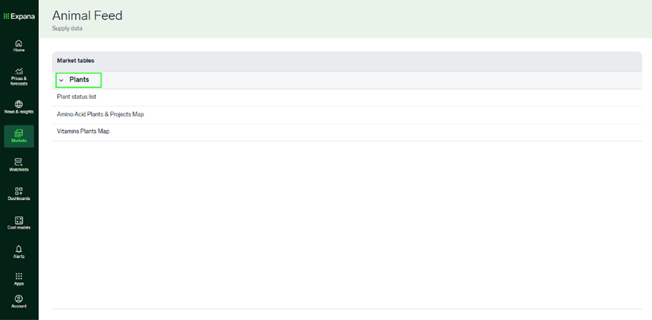
In Expana platform this information can be found under Markets > Animal Feed. You’ll see information presented as a list with collapsible sections, and can click into e.g. Plants > Plant status list to find the same information as is available in FeedInfo platform.
1. 
2. 
3. 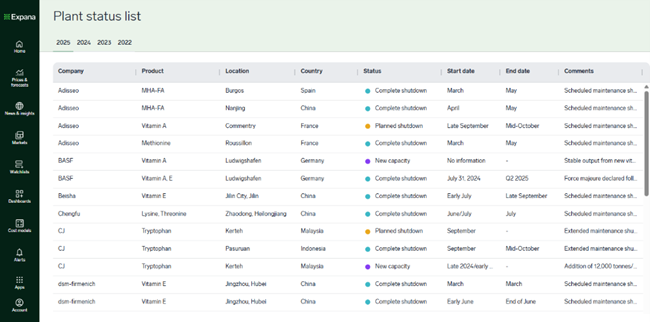
All of the columns can be sorted, e.g. to see plants with Status “unplanned shutdown” at the top of the list.
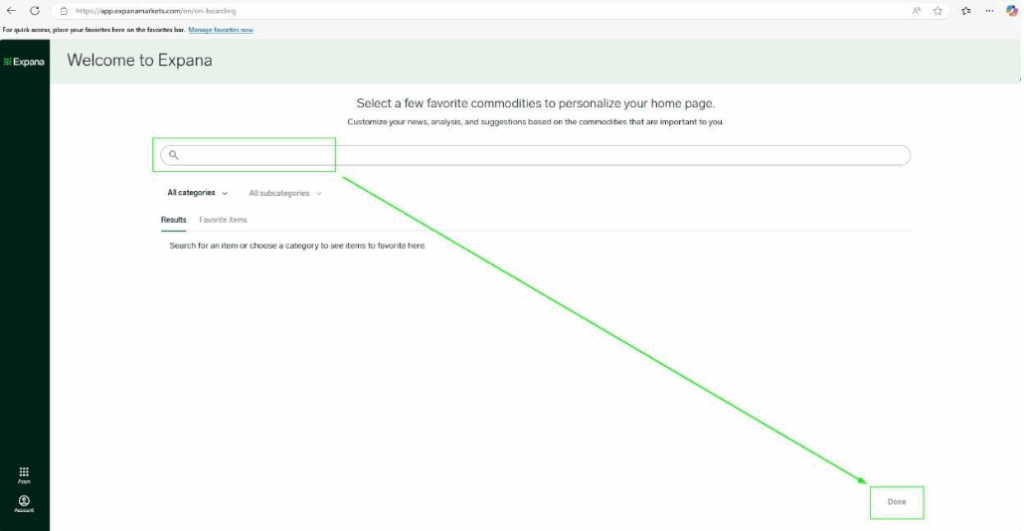
Once logged in you will see the onboarding page which asks for you to select a few favourite commodities in order to personalise your home page.
Use keywords e.g. “lysine” or “methionine solid Asia” or “soybean meal”; choose a couple to get started and it’s possible to change them later on, if needed. If looking for a specific region or incoterm then they can enter that in the search bar. You can search for as many series as you need to.
Click ‘Done’ on the bottom right of the page and you’ll be taken to your customized home page.
FeedInfo users will be migrated to the new Expana platform with notice provided to the user/s via email and on calls with your usual contact in advance. Clients should get in touch with their usual contact (Key Account Manager or Client Success Executive), or alternatively contact us [email protected].
Feedinfo will soon be discontinued for all users, following a personalized timeline based on your transition date – typically within a month. You’ll receive notifications within Feedinfo and by email before your access ends. For updates, questions, or feedback, please stay in touch with your Expana account team.
We’ll be retiring the Feedinfo platform to give you access to a more powerful experience with Expana. Built from the ground up, Expana combines the best of our legacy platforms – Urner Barry, Mintec and Feedinfo – into one unified solution. It delivers broader data coverage, smarter features and advanced tools that simply weren’t possible on the older platforms. You will be given a few weeks’ notice before we turn off the Feedinfo platform.
Resetting your password is easy. Go to platform login page, then click reset password and follow the instructions. If you have any problems, get in touch with our support team.
Yes. You can contact our Customer Success Team to request that Expana IQ is deactivated for your subscription. Please note that AI-powered search features cannot be turned off.
Expana’s private cloud infrastructure is currently hosted in the US (Azure’s ‘East US’ region). At this point in time, customers cannot choose to be hosted from other regions, but we plan to add support for this in the future.
No. Expana IQ user chat transcripts are not used to train LLMs.
However, we may review or analyse Expana IQ user chat transcripts to enable us to investigate bugs or issues so that we can improve Expana IQ for all our customers, and to enable us to learn from how users interact with Expana IQ, so that we can inform future product development to benefit all our customers.
No. All LLMs used by Expana IQ are hosted directly within Expana’s private cloud infrastructure on Azure. This enables us to ensure that any information sent to or received from LLMs remains in Expana’s private environment and is not sent to the servers of any third-party LLM providers (such as OpenAI, Anthropic or others).
No. Your Expana IQ chat transcripts are only used to serve your experience. They are not shared between customers.
However, we may review or analyse Expana IQ user chat transcripts to enable us to investigate bugs or issues so that we can improve Expana IQ for all our customers, and to enable us to learn from how users interact with Expana IQ, so that we can inform future product development to benefit all our customers.
Yes. Expana IQ user chat transcripts are stored to enable users to revisit and continue chats in the future. We also store Expana IQ user chat transcripts to enable us to investigate bugs or issues so that we can improve Expana IQ for all our customers, and to enable us to learn from how users interact with Expana IQ, so that we can inform future product development to benefit all our customers.
However, we give users control over their Expana IQ chat data – users can delete chats at any time by using the controls at the top of each Expana IQ chat window. Further user controls will be rolled out over time.
Expana IQ features continue to follow Expana’s security practices. All customer data provided to Expana is classified as Confidential and encrypted in transit (at least TLS 1.2) and at rest (at least AES-256 or equivalent). Access is limited to authorised personnel under Expana’s Access Control Policy.
Expana IQ’s use of user personal data is governed by Expana’s Privacy Policy and the Data Protection terms between Expana and the subscribing customer.
Expana IQ processes user personal data (such as Expana IQ user chat transcripts, Expana user preferences and user actions on the Expana platform) to provide users with requested information and relevant insights across the Expana platform. We will also process any feedback you choose to provide about Expana IQ features.
We take the privacy and security of your personal data seriously. Any user personal data used by Expana IQ (including Expana IQ user chat transcripts):
– Is not available to other customers and is only used to serve your experience, to help us make improvements to Expana IQ (e.g. fix bugs or issues) and to inform future product development (e.g. based on how users are interacting with Expana IQ).
– Is not sent to any LLM outside of Expana’s private cloud infrastructure and is therefore not accessible by any external third-party LLM provider.
– Is not used to train any LLMs.
Expana IQ user chat transcripts are retained by Expana for one year, unless organisations opt for an alternative retention period. Users can also delete their chats at any time.
