

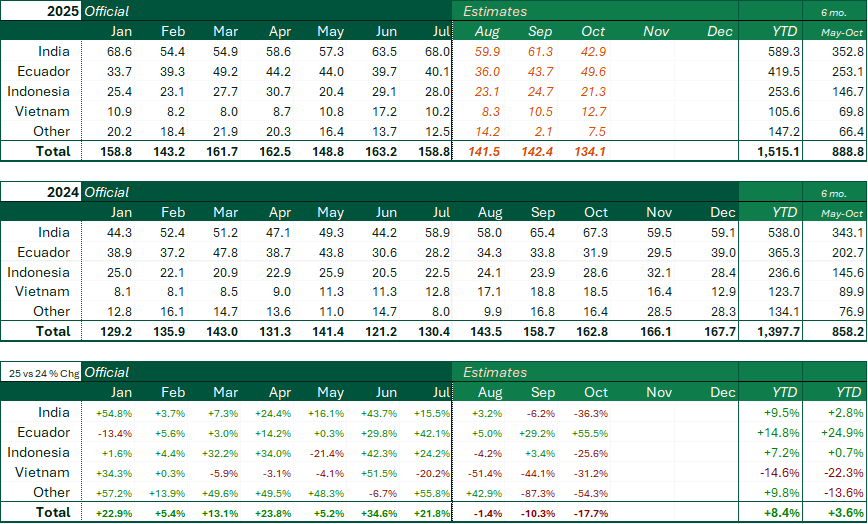
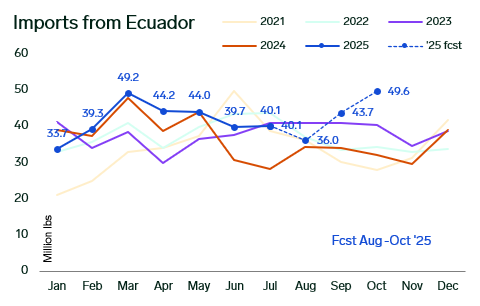
Country‑level shrimp import estimates through October show a post‑frontload correction: modeled volumes for September and October are down roughly 10% and 18% year‑on‑year, respectively, while year‑to‑date imports are up about 8% but essentially flat (+3.6%) since May. Ecuador’s volumes increase relative to other origins; India, Indonesia and Vietnam display divergent month‑to‑month paths. Model error ranges vary roughly between 9% and 18% by origin, depending on the data history. Finalized customs data and country export splits remain pending.
The tariff environment is a dominant structural factor. The 50% tariff on Indian shrimp alters competitive flows and affects margins across origin sources. Ongoing regulatory actions and shipment delays from specific origins contribute to the reallocation of trade flows and sustained price support for certain formats.
Seasonal patterns and the August–October estimates show a counter‑seasonal downtrend following the spring/summer frontrun. Reduced inflows after front‑loading shrink the supply buffer and concentrate pressure on specific counts and finished formats rather than on headline import totals.
Near-term considerations center on visibility by form and size, as well as commercial flexibility. Firms with exposure to peeled, cooked and EZ‑formats trade in a firmer price environment and maintain coverage strategies; HLSO spot trading in the US shows softer pricing with different regional dynamics in Europe. Modeling uncertainty persists until the final country‑level data are released. Tariff permanence and origin‑specific regulatory developments remain key variables that influence flow allocation and price support across formats.
Form‑level data show a bifurcated market. HLSO wholesale spot trading in the US is soft, consistent with available immediate‑delivery inventory. Peeled, cooked and EZ‑peel categories register firmer wholesale prices and tighter availability, with buyers paying premiums for finished formats. Shell‑on volumes exhibit the largest year‑on‑year swings across origins, while peeled volumes are stronger in 2025 year‑to‑date versus recent years. Aggregate tonnage masks concentrated shortfalls by form and size that affect sourcing and shelf continuity.
Retail indicators align with wholesale movements. Circana and ad‑price tracking report a roughly 5% year‑on‑year increase in retail paid prices in October, the highest level in five years, accompanied by the lowest promotional activity since 2014. Historical pass-through rates indicate that about half of a wholesale price move is transferred to consumer prices. Wholesale prices have risen by more than 20% since April, and partial retail pass-through is observable in current data.
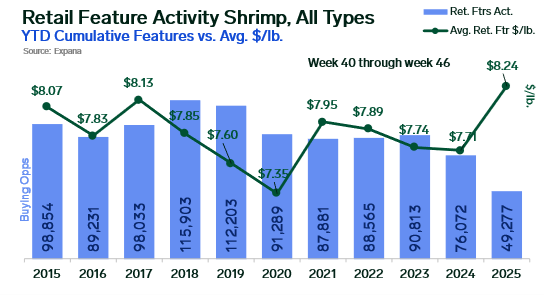
Image source: Getty
Written by Angel Rubio