

Vendors love to use headline accuracy numbers as evidence of their ability to provide relevant commodity forecasts. For procurement teams buying commodities, those percentages can look like an easy way to compare providers. The problem: accuracy figures are frequently presented without context and can be deeply misleading. Procurement decisions require forecasts that are actionable for a specific commercial use case, not a statistic presented without any way to verify it and no proof of practical benefit or decision-making value.
Why Common Accuracy Metrics Can Be Misleading
Accuracy numbers in commodity forecasting are often anchored to how closely forecasted prices match actual prices – typically quantified using deviation-based measures like Mean Absolute Percentage Error (MAPE). While these metrics appear objective and comparable, they overlook what procurement teams actually care about: actionable insights into price direction and movements that affect commercial decisions.
The core problem is that the size of forecast deviations is heavily influenced by the underlying volatility of the commodity, not by the real value or business usefulness of the forecast. In calm markets with low volatility, even naive or consistently wrong forecasts can report “high accuracy” simply because price movements are small, masking poor forecasting ability.
Consider this example:
The current price of a commodity is $102.
You forecast that the price will increase to $105 next month.
In reality, the price decreases to $100.
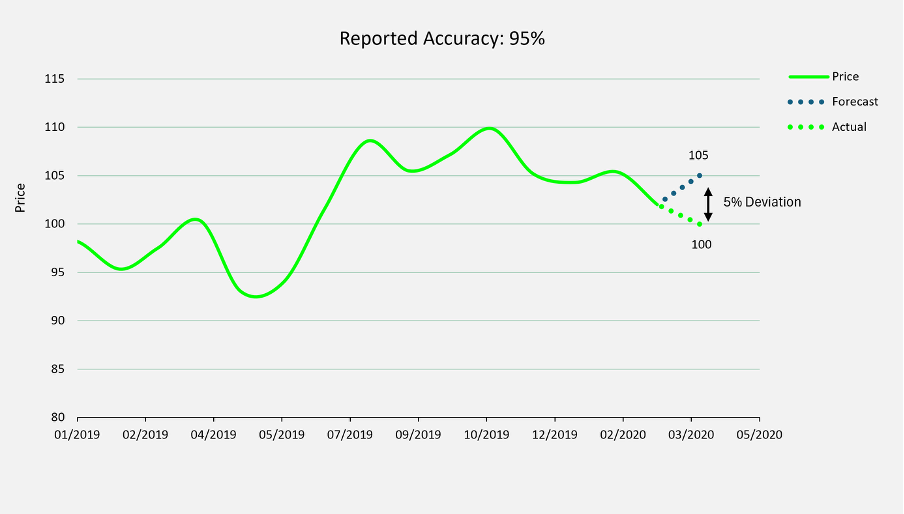
On a deviation-based metric like MAPE, this forecast looks excellent: The difference between the forecast and the actual price is 5%, resulting in vendors reporting a 95% accuracy. Yet this number is deeply misleading. If you had acted on this forecast, such as locking in a buy, hedging, or making procurement decisions, you would have bet against the actual market movement and potentially lost money. The metric ignores the fact that the forecast moved in the opposite direction of reality.
This disconnect means that even high “accuracy” numbers can conceal forecasts that offer little to no business value, or worse, could lead you to make the wrong call. Procurement teams need to be wary of metrics that reward small deviations over correct directional calls or actionable insights.
Volatility, Not Skill, Drives Most Forecast Accuracy Claims
When evaluating forecasts, it’s important to consider the typical volatility of the commodity over different horizons. For example, if a commodity has an annual volatility of 15%, this translates to:
1 month ≈ 4.3% volatility
3 months ≈ 7.5% volatility
6 months ≈ 10.6% volatility
12 months = 15% volatility
Because deviation-based accuracy metrics are driven by how much prices typically fluctuate, even a naive forecast that predicts no change will, on average, only deviate from the realized price by an amount in line with the volatility for that horizon.
Average accuracy for naive forecasts:
1 month horizon: 95.7% accuracy (4.3% deviation)
3 month horizon: 92.5% accuracy (7.5% deviation)
6 month horizon: 89.4% accuracy (10.6% deviation)
12 month horizon: 85% accuracy (15% deviation)
These high accuracy numbers can be achieved with zero forecasting skill. They simply reflect the typical size of price movements, not actual predictive insight. For buyers focused on hedging and timing, it’s vital to recognize that deviation-based metrics can dramatically overstate the true usefulness of a forecast when volatility is modest.
Real Transparency & Actionable Value: The Expana Approach
At Expana, we believe transparency is essential. Rather than reporting high accuracy numbers that can’t be meaningfully applied to real procurement decisions, we put actionable information front and center for our customers.
With Expana’s core forecasts, users have full access to historical forecast targets, so you can see exactly what was predicted and compare it to what actually happened. We also provide a complete archive of historical hedging recommendations and accompanying videos that explain any changes in guidance, ensuring our clients understand the decision logic behind every recommendation.
Expana’s users get direct access to all underlying graphs and analyses that power our forecasts, allowing you to see precisely what drives our market outlook. This means every forecast and recommendation is fully traceable, giving your team the ability to evaluate what actions you might have taken and the practical impact those actions could have had.
Importantly, we have a proven track record of users reporting real, measurable savings based on Expana’s forecasts and recommendations. We don’t hide behind misleading metrics that mask true performance. Instead, we empower our customers with the information and transparency they need to make informed, confident decisions.
To access actionable forecasts, request a demo.
Written by Frederik Kildedal