Crab prices today
Snow crab and crab meat prices swing with Canadian and Alaskan landings, cold storage levels and import competition. Expana assesses crab clusters, pasteurised meat grades and the main origins, and adds crab market forecasts and intelligence on top.
Buyers, processors and importers use our crab data to check what they pay, follow supply news and prepare for the next season.
Crab price chart
| Date | Price (USD/lb) | MoM % | QoQ % | YoY |
|---|---|---|---|---|
|
Unlock
Unlock our crab prices and future forecasts.
|
||||
| 9.8 | ↑ 1.6% | ↑ 0.5% | — | |
| 9.8 | ↑ 3.2% | ↑ 0.5% | — | |
| 9.8 | ↑ 3.2% | — | — | |
| 9.8 | ↑ 3.7% | — | — | |
| 9.8 | ↑ 4.3% | — | — | |
| 9.8 | ↑ 4.8% | — | — | |
| 9.8 | ↑ 5.4% | — | — | |
| 9.65 | ↑ 3.8% | — | — | |
| 9.65 | ↑ 4.9% | — | — | |
| 9.65 | ↑ 4.9% | — | — | |
| 9.5 | ↑ 3.3% | — | — | |
| 9.5 | ↑ 2.2% | — | — | |
| 9.45 | ↑ 1.6% | ↓ 12.1% | — | |
| 9.4 | ↓ 1.1% | ↓ 12.6% | — | |
| 9.35 | ↓ 1.6% | ↓ 13.0% | — | |
| 9.3 | ↓ 4.6% | ↓ 11.4% | — | |
| 9.3 | ↓ 4.6% | ↓ 11.4% | — | |
| 9.2 | ↓ 5.6% | ↓ 12.4% | — | |
| 9.2 | ↓ 5.6% | ↓ 12.4% | — | |
| 9.2 | — | ↓ 12.4% | — | |
| 9.25 | — | ↓ 11.9% | — | |
| 9.3 | — | ↓ 10.6% | — | |
| 9.35 | — | ↓ 10.1% | — | |
| 9.5 | — | ↓ 8.7% | — | |
| 9.55 | — | ↓ 8.2% | — | |
| 9.75 | — | ↓ 6.3% | — | |
| 9.75 | — | ↓ 6.3% | — | |
| 9.75 | — | ↓ 5.3% | — | |
| 0 | — | ↓ 100.0% | — | |
| 0 | ↓ 100.0% | ↓ 100.0% | — | |
| 0 | ↓ 100.0% | ↓ 100.0% | — | |
| 0 | ↓ 100.0% | ↓ 100.0% | — | |
| 0 | ↓ 100.0% | ↓ 100.0% | — | |
| 0 | ↓ 100.0% | ↓ 100.0% | — | |
| 0 | ↓ 100.0% | ↓ 100.0% | — | |
| 0 | ↓ 100.0% | ↓ 100.0% | — | |
| 0 | ↓ 100.0% | ↓ 100.0% | — | |
| 0 | ↓ 100.0% | ↓ 100.0% | — | |
| 0 | ↓ 100.0% | ↓ 100.0% | — | |
| 10.75 | ↑ 3.4% | ↑ 11.4% | — | |
| 10.75 | ↑ 3.4% | ↑ 11.4% | — | |
| 10.75 | ↑ 3.4% | ↑ 11.4% | — | |
| 10.5 | ↑ 1.0% | ↑ 10.5% | — | |
| 10.5 | ↑ 1.9% | ↑ 10.5% | — | |
| 10.5 | ↑ 1.9% | ↑ 10.5% | — | |
| 10.5 | ↑ 4.5% | ↑ 10.5% | — | |
| 10.4 | ↑ 3.5% | ↑ 9.5% | — | |
| 10.4 | ↑ 5.1% | ↑ 9.5% | — | |
| 10.4 | ↑ 5.1% | ↑ 9.5% | — | |
| 10.4 | ↑ 7.2% | ↑ 9.5% | — | |
| 10.4 | ↑ 7.2% | — | — | |
| 10.4 | ↑ 7.2% | — | — | |
| 10.4 | ↑ 7.2% | — | — | |
| 10.3 | ↑ 6.2% | — | — | |
| 10.2 | ↑ 5.2% | — | — | |
| 10.05 | ↑ 4.1% | — | — | |
| 9.9 | ↑ 2.6% | — | — | |
| 9.9 | ↑ 2.6% | — | — | |
| 9.7 | ↑ 0.5% | — | — | |
| 9.7 | ↑ 2.1% | — | — | |
| 9.7 | ↑ 2.1% | — | — | |
| 9.7 | ↑ 2.1% | — | — | |
| 9.7 | ↑ 2.1% | — | — | |
| 9.7 | ↑ 2.1% | — | — | |
| 9.7 | ↑ 2.1% | — | — | |
| 9.65 | ↑ 1.6% | — | — | |
| 9.65 | ↑ 1.6% | — | — | |
| 9.65 | ↑ 1.6% | — | — | |
| 9.5 | — | — | — | |
| 9.5 | — | — | — | |
| 9.5 | — | — | — | |
| 9.5 | — | — | — | |
| 9.5 | — | — | — | |
| 9.5 | — | — | — | |
| 9.5 | — | — | — | |
| 9.5 | — | — | — | |
| 9.5 | — | — | — | |
Expana: independent crab prices backed by specialist reporting
With 49 Expana Benchmark Prices across Russia, Alaska, the US, Canada, China and Southeast Asia, our crab coverage is built from market indications gathered by specialist reporters. Commentary on landings, cold storage and import flows explains the moves behind each price. The snow crab cluster Newfoundland benchmark is IOSCO assured, giving the market an independently reviewed reference.
Crab coverage is led by Janice Schreiber, Managing Editor, Seafood. Explore related coverage on our seafood, lobster prices and shrimp prices pages.
Crab benchmarks across six regions
49 Expana Benchmark Prices covering crab from Russia, Alaska, the US, Canada, China and Southeast Asia.
Price forecasts
Core crab forecasts out to 18 months, including price targets, bands and a hedging indicator for buyers.
Clusters and crab meat grades
Snow crab clusters and pasteurised crab meat, including lump, colossal and special grades.
Landings and stock tracking
Landings in Canada and Alaska, cold storage levels and the overall supply-demand balance.
Price history
Full price history, with month-on-month, quarter-on-quarter and year-on-year change.
Expert commentary
Regular analysis of landings, quotas and import competition in the crab market.
What our crab intelligence covers:
Crab price forecast
Crab prices move with landings in Canada and Alaska, cold storage stocks, import competition and seasonal demand. Expana’s crab forecasts add a forward view out to 18 months.
- Crab price projections up to 18 months ahead.
- Near-term signals from landings, quota news, cold storage draws and imports.
- Context from our benchmark prices in Russia, Alaska, the US, Canada and Asia.
- A read on the supply-demand balance, which has been in surplus and weighed on prices.
- Seasonal patterns in snow crab demand and pricing.
- Scenarios for quota changes and stronger or weaker import competition.
- Analyst notes explaining each change in the crab outlook.
Forecast methodology last reviewed: October 2026.
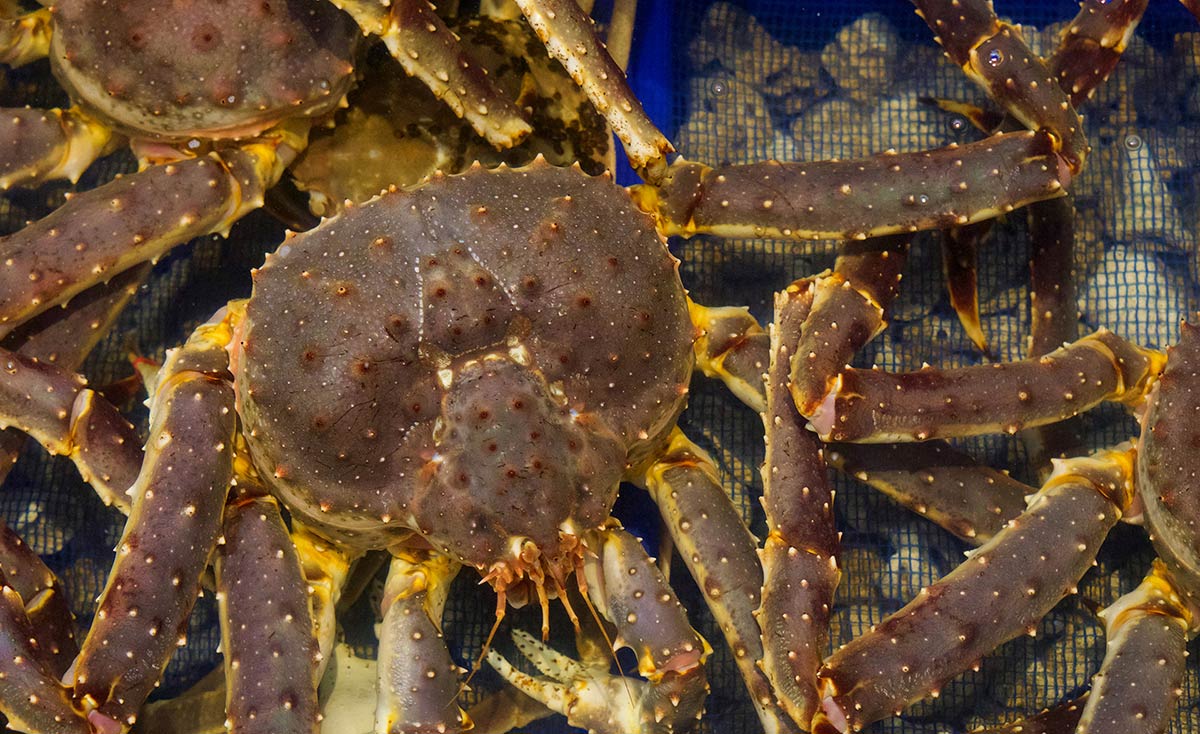
Our crab forecasting methodology
Our crab market forecasts start with supply, look at demand and trade, and then test both against price trends.
- Macroeconomic signals
We track consumer demand, trade and import competition across the main crab markets. - Technical indicators
MACD, RSI and moving averages help us spot when momentum is building or fading, including oversold readings. - Fundamental analysis
We weigh landings, cold storage stocks and the supply-demand balance against a fair value band.
Our snow crab cluster Newfoundland benchmark is IOSCO assured. Read more about our price assessment methodology. It gives buyers, processors and traders a dependable basis for negotiations, budgets and contract timing.

Looking for full insights on the crab market? Get a demo today.
Latest crab news and insights
Analysis from our seafood experts.


Crab Market FAQs
What drives crab prices?
Crab prices are set by landings in the main producing regions, led by Canada and Alaska, along with cold storage stocks, import competition and seasonal demand. Quota decisions and the timing of each season can tighten or loosen supply quickly.
Why do snow crab prices move so sharply?
Snow crab is landed in defined seasons under quota, so a change in catch limits or a slow start to a season can move prices fast. Cold storage carryover and import flows from Russia and Asia also swing the balance between harvests.
What crab grades does Expana cover?
Expana covers snow crab clusters by size and region, and pasteurised crab meat in grades such as lump, colossal and special. Benchmarks span Russian, Alaskan, US, Canadian and Asian product.
What factors influence crab price forecasts?
Key factors include landings and quota, cold storage stocks, the supply-demand balance, import competition, seasonality and technical signals such as moving averages and RSI.
What is the crab price forecast?
A crab price forecast is a forward-looking view of how prices may develop over a set period, weighing supply, stocks, demand and seasonality. Expana’s Core forecast projects crab prices out to 18 months with price targets, bands and commentary.



Essential intelligence for industry professionals
Expana delivers essential intelligence to industry professionals across seafood markets, ensuring business leaders stay informed about the latest prices and industry trends, enabling them to effectively navigate disruptions, manage prices, and deliver value to their customers.