

Key Takeaways
- Expana’s ingestion platform runs almost 3,000 modules across around 500 sources, every one of them on the same four-stage interface that is orchestrated through Airflow, firing roughly 3,400 scheduled runs a week and powering around 45,500 commodity time series.
- Agent instructions live with the ingestion code, and the targeted use of AI has massively accelerated how quickly Expana brings on new sources and adapts when existing ones change shape. Everything generated still passes a human check.
- There are many forms of data ingestion within Expana’s ingestion codebase. Web scraping, licensed APIs, SFTP drops and emailed files all land through the same contract, with identical lineage and licence handling.
- Whatever a module collects, it comes out in a standardised schema, with every row traceable back to the ingestion run that produced it. Telemetry from those runs is fed straight back through the platform, so it can watch how its own sources are behaving over time.
- Quality checks run in memory before anything is written, and they are advisory on purpose: a failing check flags rather than blocks, because a given day’s number cannot be collected again tomorrow.
Arabica coffee from Brazil. Chicken breast in the US. Rapeseed oil loaded at Rotterdam. Grains, feed, freight rates and the weather that moves them all.
Expana is the largest IOSCO-assured price reporting agency for the agrifood industry, publishing benchmark prices across more than 900 commodities. Before any of that becomes a price a procurement team can contract against, somebody has to go and get the underlying data, and that data lives in a few thousand places never designed to be read by a machine.
The estate
Our unified ingestion platform is a single monorepo containing almost 3,000 ingestion modules, one per source-and-location pair, covering around 500 sources. Everything the platform collects comes from outside Expana: some of it public and free, some commercially licensed, arriving by scrape, API, FTP or email depending on what the publisher offers. Between them those modules declare around 45,500 time-series codes. One module is not a unit of consistent size: some pull a single price, others tens of thousands.
Everything is addressed through one taxonomy. Every module carries the same three-part identity: which product the data feeds, which source it came from, and which market or location the numbers describe. Metadata, quality contracts and output are all filed under those same coordinates. That metadata is schema-enforced, including a mandatory ownership triple: business owner, technical owner, operational owner. Every module in the estate has a named human on all three axes.
Every source is a special case
Fetching a web page is the easy bit. The problem is that our modules declare more than 3,000 separate inputs between them. They differ in transport, in format, in what credentials they need, and in how often they change shape.
Some of our data is licensed and arrives through a formally specified API or a nightly SFTP drop. Some is published on a government website as an HTML table or a PDF. Some arrives as a spreadsheet attached to an email. The platform’s job is to make all of it land in the same shape, with the same lineage, quality and licence treatment, whichever door it came in through.
A meaningful slice of the world’s commodity price data is published as a table inside a scanned PDF, so a good part of the platform is dedicated to table extraction and OCR. There is no elegant solution to that. There is only careful parsing and test coverage.
A good proportion of those inputs require authentication, much of it licensed data where the credentials are ours under contract and the licence terms govern how the data can be stored, used and redistributed. What each source permits is tracked too, with site permissions archived, published terms held as structured records, and paid licences recorded against the feeds they cover. That is a post of its own, and we will write it.
The contract
Every single ingestion module implements the same four-stage interface. One stage fetches raw bytes and does no parsing whatsoever. One turns those bytes into a standard in-memory table. One sequences the run: fetch, store the raw payload, parse, check quality, write. One hands the whole thing to a shared runner that owns execution.
Keeping fetch and parse apart is what makes the rest testable. Parsing becomes a pure function from bytes to a table, so it can be exercised against mocked payloads or against real ones captured in production, with no network involved either way. When a publisher changes their layout, the payload that broke production becomes the fixture, and the fix is proven against the exact input that caused it:
raw = load_fixture("publisher_2026_03_14.html")
table = ExampleSource().parse(raw, interval_end=date(2026, 3, 14))
assert table.num_rows == 42
No mocking, no network, no credentials. Mocks only appear when a whole run is being exercised, because fetching is the only part of a module that touches the outside world:
monkeypatch.setattr(source, "fetch", lambda: raw)Around 6,000 test functions do that work.
This pattern also makes runs idempotent in that a retry lands on the same output path and no-ops instead of writing a second copy. A half-finished run and a clean one end up identical. At this scale retries are routine rather than exceptional, and a pipeline where re-running is risky is a pipeline nobody wants to touch during an incident.
The large majority of modules now run under the shared runner, and the remainder are being brought onto it, because “we standardised everything” is never true while the work is still in flight, and we’d rather say so.
Two rules in that interface do most of the work.
datetime.now() is banned. Every module takes its clock from the Airflow task instance’s data interval. A re-run of Tuesday’s task at Friday lunchtime still writes Tuesday’s partition. That one rule is the difference between a pipeline you can reason about and one where every incident investigation starts with “when did this actually run?”
A pre-flight check stops backfills from lying. Many endpoints only ever serve “latest”, with no history to ask for. If a source’s metadata says no historical data is available, the runner refuses to run unless the scheduled interval is today. Without that check, a backfill quietly re-collects today’s number and stamps it with a date from 2023.
How it fits together
Everything below is a walk through that picture. How a module is built, when it runs, where the output lands, and how we decide whether to trust it.
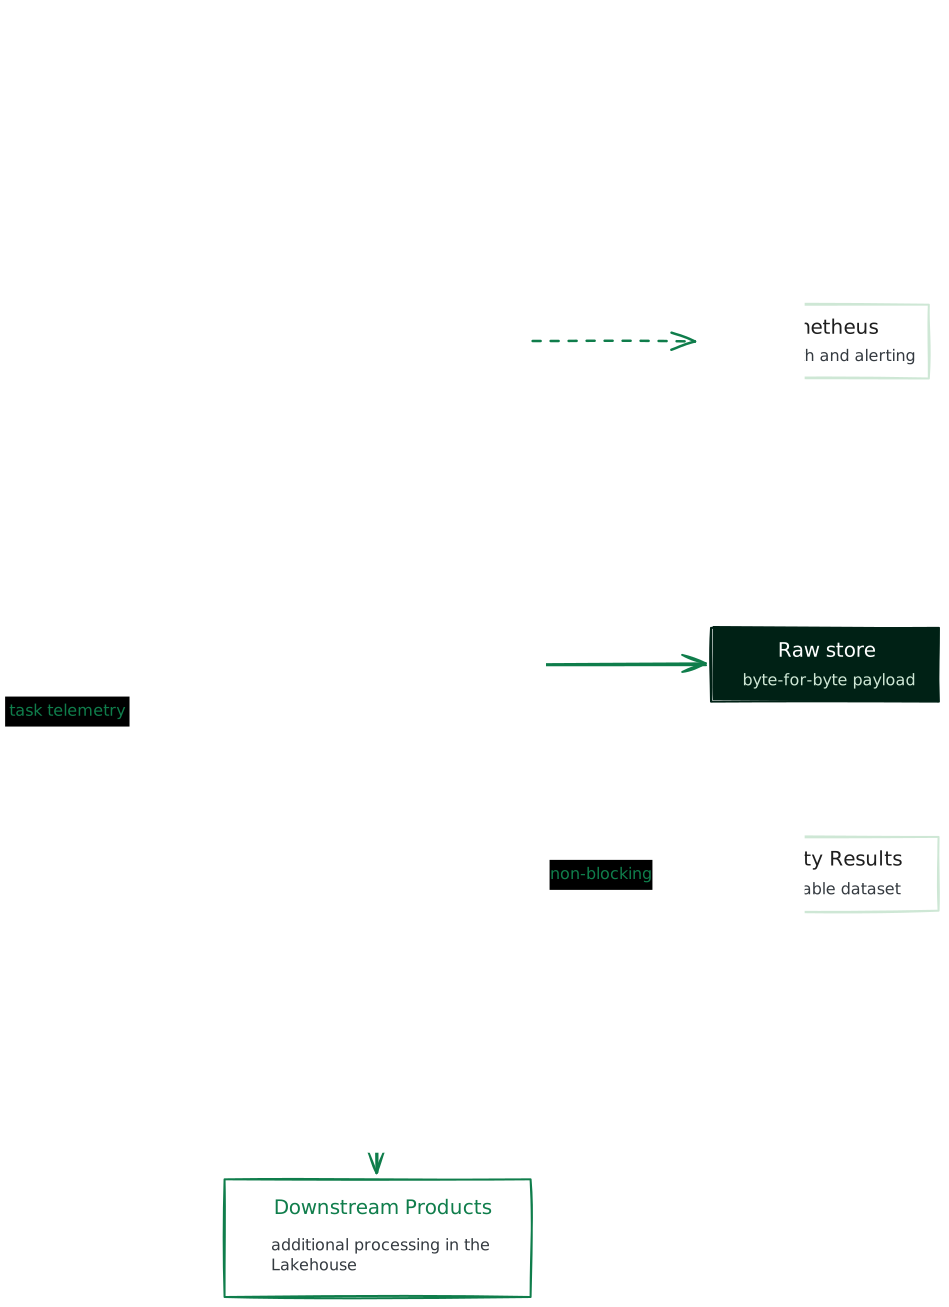
Everything below is a walk through that picture. How a module is built, when it runs, where the output lands, and how we decide whether to trust it.
Cadence: the world does not publish smoothly
Airflow orchestrates the estate, running every task in its own Kubernetes pod. The DAGs are generated from YAML by an in-house factory, so onboarding a module means adding a task block to a config file rather than writing a DAG.
Tasks are scheduled in source-local time rather than in UTC, because a report published at 08:30 in Washington is published at 08:30 in Washington twice a year regardless of what London thinks. That is really a latency decision. A task runs shortly after its source publishes rather than at an hour that suits us, so the gap between a number appearing in the world and the platform holding it is set by the publication calendar rather than by a batch window of our own. Sources that publish to no fixed calendar are polled rather than guessed at. Together it adds up to roughly 177,000 scheduled executions a year.
The load is extremely uneven, and that is inherent to the domain rather than a fault. Our heaviest window of the entire week falls at 17:00 on a Friday, which is not an hour any engineer has ever volunteered to be near a pipeline. We are scheduled by the world’s report release calendars, not by anyone’s preferences, so the processes around those peaks have to run unattended.
Retries are tiered by cadence, on the logic that a daily source will be back tomorrow so it can fail fast, while an annual print will not.
| Cadence | Retries | Base delay | Cap | Backoff |
| Daily | 5 | 1 min | 1 h | exponential |
| Weekly | 5 | 10 min | 5 h | exponential |
| Monthly / quarterly / annual | 5 | 30 min | 5 h | exponential |
| Event-triggered | 1 | 5 min | n/a | n/a |
Storage: keep the evidence
We dual-write every collection. The raw payload lands byte-for-byte in its own container before anything is parsed, and the parsed output is written separately. When a source changes shape and the parser stops matching it, which sources do without warning, the original bytes are still there to reprocess against.
Parsed output is partitioned Parquet on one canonical Arrow schema, as a team we settled on three rules:
- Prices are decimals, not floats. No binary floating-point drift on money.
- Values are a map with an enforced key allowlist, so one schema covers a spot price, a bid/ask range and a traded volume without a column-per-source explosion.
- Every row carries the UUID of the job invocation that produced it, so any number in the lake traces back to its run.
The quality check, and why it doesn’t block
Quality contracts run in memory against DuckDB, on the table, before it is written. There is no round-trip to the warehouse, so problems surface while the data is still in hand rather than after it has landed. Contracts resolve in four tiers, from a global floor every source must meet to rules generated at runtime from the module’s metadata.
The floor is deliberately basic. Rows exist, no duplicates, key fields present. Above it sit per-series range bounds, freshness thresholds calibrated from the observed write gap rather than from what someone assumed the source does, and a coverage check requiring a threshold percentage of the declared series to appear in the output. Coverage catches the quietest failure of all, a site redesign after which the module still succeeds and still writes rows, just half as many series as yesterday.
It’s important to note that the check is advisory. A failing check logs a warning, and the write proceeds anyway.
This runs against the usual instinct, for a reason specific to collected data. You get exactly one shot at a given day’s number, because tomorrow the page shows tomorrow’s value. Blocking the write to punish a failed check doesn’t protect the warehouse. It destroys the only copy of the evidence and guarantees a permanent hole in the series. So we land it, flag it, and let the pattern surface downstream.
None of which works unless the flag goes somewhere. Every run writes its per-check results out as Parquet, so “is this source degrading?” is a SQL question rather than a matter of checking a log. Failures inside the quality layer are themselves only warnings, because the observability layer must never take down the pipeline it observes.
Building with an agent
The work is repetitive in shape and unique in detail, which is what an agent is good at provided you give it the detail.
So we check the instructions in with the code, as CLAUDE.md files at three levels. The agent loads whichever ones cover the files it is working on:
- Root. Check the state of the repo before starting anything non-trivial. If something expected is missing, assume the checkout is out of date rather than concluding it was never built.
- Shared. How a module should be written: the standard structure, which shared helpers to reach for rather than rolling your own, and the rules, including taking the clock from the Airflow data interval rather than the machine.
- Per source. What the code cannot show: publication lag, how that site signals failure, and past misdiagnoses, such as the publisher whose malformed requests return a 401 rather than a 404.
Recurring jobs are written up as skills, one per job. One brings a module onto the standard pattern, another calibrates a batch of quality contracts, another opens the pull request. The steps are the cheap part. Most of what a skill is worth is the traps it records. Moving a module onto the shared runner, for instance, quietly makes one metadata field required, so the pre-commit checks fail on a ticket that said no YAML changes were needed.
Each skill also states what it must not touch, because several playbooks overlap on the same files and the real risk is the right edit from the wrong one. Every skill ends at a verification step that produces evidence rather than an assertion, with old and new output sorted and compared row for row.Nothing generated merges itself. One source per pull request, and every generated threshold is reviewed before it lands.
What we’re aiming for
The hard problem at this scale was never fetching. It is that almost 3,000 ingestion modules have almost 3,000 different ways to fail, and most of them fail politely, returning a success code and a well-formed page with half the series missing. Everything above exists to make failure impossible to miss. One interface, one schema, one clock, one identity, and one place to ask whether a source is degrading.
Including for the platform itself. Live health is watched the ordinary way, through Prometheus metrics and alerting. The more interesting layer sits behind it. Task telemetry is ingested back into the lake through the platform’s own pipeline, where it answers the slower questions, such as whether a source has been quietly getting less reliable over months. The ingestion platform ends up monitoring itself with its own ingestion pipeline.
None of this is ever finished. Publishers redesign their sites, licences change, sources die and new ones arrive, and the estate has to absorb all of it without anybody downstream noticing. Getting that to be unremarkable is the work, and there is plenty more of it to write about.
If you’d like to be a part of projects like this with Expana’s Engineering team, check our Vacancies page for available roles.
Written by Martin Grayson

