Key Takeaways
- Packaging prices jumped 20% March-May on Iran-related conflict, hitting $1,907/mt on the Expana Global Packaging Index — the anticipated summer decline never fully materialized.
- Abnormal European heat drove a surge in bottled water, soft drink and beer demand right as prices were expected to ease, pushing beverage producers to buy PET, aluminum and glass at the worst possible moment.
- Aluminum can stock prices rose 10.8% MOM in the EU and 2.5% MOM in the US; renewed Iran conflict in July pushed LME aluminum up 3.1% in the first week alone.
- Two forces are stacking at once: genuine consumption-driven demand and precautionary buying against fears of another cost spike — and official production stats haven’t caught up to either yet.
- The real procurement task is separating structural pressure from sentiment-driven buying, category by category, week by week — not just watching one index.
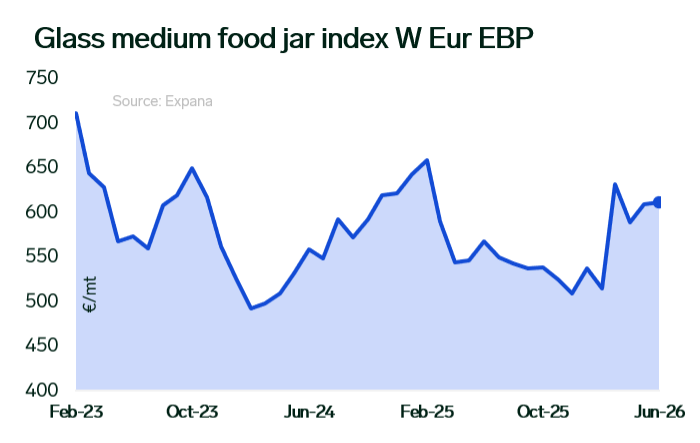
Packaging raw material prices rose sharply in March–May amid military activity in Iran. According to the Expana Global Packaging Index, prices rose 20% over the three-month period, reaching $1,907/mt in May. After the parties to the conflict entered negotiations in May–June, the market anticipated a gradual decline in packaging prices, particularly in Europe and Asia, which are significantly dependent on oil and gas imports. However, the decline proved limited across many markets and product categories. Oil and natural gas corrected from peak levels, aluminum also partially retreated, and logistics conditions eased in June following the reopening of the Strait of Hormuz.
Source: Expana
The market dynamic began shifting in June, particularly in the beverage industry. Abnormal heat across Europe drove increased consumption of bottled water, soft drinks, beer and other products whose demand traditionally accompanies higher packaging consumption. Demand surges were also recorded in China and the US. As a result, beverage producers increased purchases of polyethylene terephthalate (PET) bottles, aluminum cans and glass containers at precisely the moment the market had been expecting price declines.
Aluminum can prices rise
Aluminum can stock prices from warehouse rose 10.8% MOM in the EU and 2.5% MOM in the US. An additional factor was awareness of the fragile US–Iran ceasefire: market sources report that, beyond seasonal demand growth, some packaging buyers secured volumes earlier than usual against the risk of further price escalation, generating incremental demand. In the plastics markets, producers faced sharply higher prices as production costs rose following supply disruption to feedstock exports from Gulf states, which supply a significant share of Asia’s and Europe’s naphtha for ethylene production. The cessation of natural gas exports from Qatar to Europe also drove markedly higher energy costs, and glass manufacturers raised end-product prices by between 5% and 7% to offset the rise in production costs.
Further support came from renewed escalation of the military conflict in Iran in July, which heightened tensions around the Strait of Hormuz and raised the risk of resumed Houthi attacks on vessels in the Red Sea. Beyond constraining oil and aluminum supply, Expana analysis suggests this could disrupt supply chains and reroute logistics between Asia and Europe in particular. Aluminum prices on the LME rose by 3.1% in the first week of July alone. Although an actual supply deficit has not yet materialized, rising uncertainty has already begun to be reflected in market participants’ expectations, with market sources reporting that some companies have secured purchase volumes in advance.
As a result, two price support mechanisms are operating simultaneously. The first is genuine growth in packaging consumption driven by increased beverage demand. The second is advance purchasing driven by expectations of a new wave of rising raw material and energy costs.
Full shift not yet captured
Official statistics have not yet fully captured these shifts. Soft drink and bottled water production in the Eurozone rose by only 0.9% YoY in the first five months of the year. Grape wine production fell 4.7% YoY, although cider and fruit wine production, despite representing a small share, grew 2.6% YoY. Beer production declined 1.5% YoY. Soft drink and ice production in the US fell 1.3% YoY over the same period. In China, alcoholic beverage production rebounded strongly in April and May after contracting in Q1 2026. Production figures are released with a lag, while market sources are already reporting heightened demand activity and sustained high capacity utilization among packaging producers.
Conclusion
The packaging cost environment beverage producers are navigating right now is not a single trend. It is two separate forces operating at once: consumption-driven demand pulling on supply in one direction, and precautionary purchasing adding pressure in the other. Official production statistics are still catching up with what market participants are already seeing. In that gap between lagged data and live market conditions, the quality of the intelligence informing procurement decisions matters considerably.
For procurement teams managing packaging across PET, aluminum and glass, the practical challenge is understanding which price pressures are structural and which are sentiment-driven, and what the supply conditions underlying each category look like week to week. Those are questions that need more than one series to answer.
Expana tracks the packaging complex through dedicated benchmark price assessments covering aluminum, PET, glass and associated feedstocks, including the Expana Global Packaging Index referenced throughout this article. Those assessments are made independently, following the IOSCO Principles for Price Reporting Agencies, and sit alongside more than 2,000 forecasts and 37,000 price series across food and agricultural commodities.
For a beverage producer managing packaging cost alongside broader input exposure, that means one platform covering the materials on the production line and the agricultural commodities behind what goes into the bottle or can. Visibility across both is what makes it possible to separate signal from noise in a market where there is plenty of each. If you’re interested in finding out more about how Expana can support your packaging decisions, request a demo here.
Data and analysis accurate as of July 24, 2026. For educational purposes only.
This commentary is prepared by Expana and its group of companies, neither of which is an investment firm. We have no positions in the commodities or derivatives referenced. The views expressed are for information only. See our disclaimer for more information: https://www.expanamarkets.com/disclaimer/
Written by Artem Segen and Andrew Woods