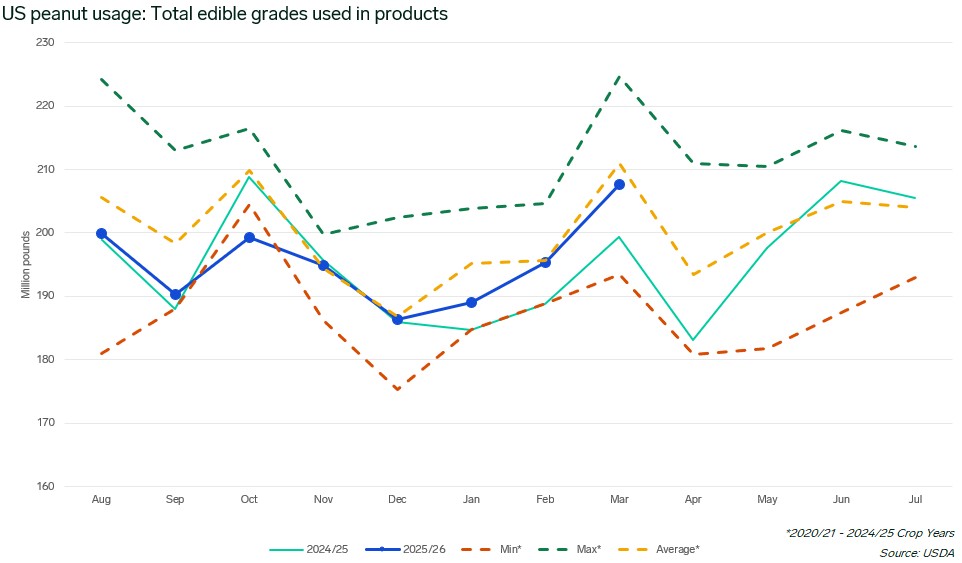
On April 27, the USDA released the March 2026 Peanut Stocks and Processing report. The release provides information on stocks on hand as well as volumes used or processed for different purposes, with the April update expected in late May. In its monthly Peanut Market Insight report, Expana includes the chart below, which tracks volumes of edible-grade peanuts used in various food products compared to recent years and the trailing five-year average covering the 2020/21 through 2024/25 crop years.
March usage
March usage in products was reported at 207.7 million pounds, representing a month-over-month (MOM) increase of 12.3 million pounds, up 6.3%. Usage was 8.3 million pounds higher than March 2025, up 4.2%. This figure was 1.6% below the trailing five-year average of 210.9 million pounds for March.
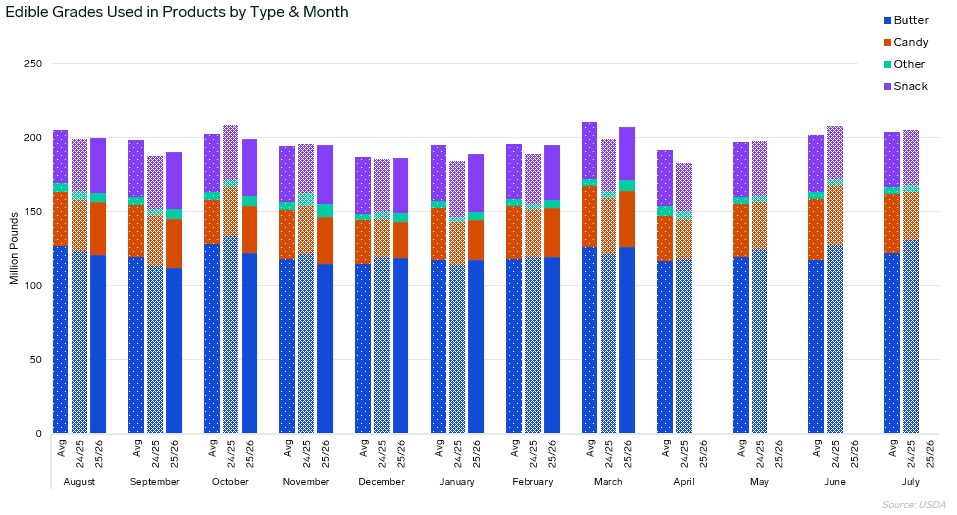
Of the 207.7 million pounds, the usage breakdown is as follows:
- Peanut butter: 126.2 million pounds, up 6.9 million pounds MOM, 0.1% below the March average
- Candy: 37.8 million pounds, up 4.6 million pounds MOM, 7.8% below the March average
- Snack: 36.4 million pounds, down 0.7 million pounds MOM, 6.2% below the March average
- Other: 7.3 million pounds, up 1.5 million pounds MOM, 50.8% above the March average
Year-to-date accumulation
The first eight months of the 2025/26 marketing year show an accumulation of 1,562.9 million pounds of edible grades used in products. This is 1.7% below the five-year average of 1,589.6 million pounds for the August-March period but 0.8% above the same period in 2024/25 (1,550.4 million pounds). The current year’s accumulation continues to track closer to historical norms.
Of the 1,562.9 million pounds used through March, the breakdown by category is as follows:
- Peanut butter: 950.6 million pounds, 1.9% below the five-year average for the August-March period and 1.6% below the same period in 2024/25
- Candy: 254.7 million pounds, 8.0% below the five-year average for the August-March period and 2.0% below the same period in 2024/25
- Snack: 304.6 million pounds, 0.1% below the five-year average for the August-March period but 7.5% above the same period in 2024/25
- Other: 53.1 million pounds, 36.1% above the five-year average for the August-March period and 28.6% above the same period in 2024/25
The year-to-date figures show snack usage performing notably stronger than the prior year despite March’s monthly decline, while the “Other” category continues to significantly outpace both the trailing five-year average and prior-year levels. Peanut butter usage, while representing the largest volume, trails both historical norms and prior-year pace. Candy usage remains below both benchmarks, consistent with the monthly pattern observed throughout the marketing year.
USDA revisions impact
According to market sources, adjustments to previous months were not a significant factor in this release, though further clarification was provided regarding earlier revisions. Much of the previous revisions were attributed to catching up on reporting practices with some manufacturers. Sources note that some revisions likely account for the prior crop year as well, which means while totals and balance sheet categories are aligning better, period comparisons may be somewhat skewed. Market participants suggest actual demand is likely better than previously reported but also likely not as strong as levels currently reported by the USDA. Overall, market participants are comfortable with the general demand picture, though continued monitoring remains warranted.
Peanut market outlook
Market participants report an uptick in activity recently as the narrative for the 2026/27 crop begins to take shape and growers enter planting season. Expectations point toward significant acreage reductions for the upcoming crop year.
Demand fundamentals continue to show mixed signals, with the March figures demonstrating solid month-over-month growth but remaining slightly below historical averages. The substantial increase in the “Other” category usage stands out, though this remains the smallest segment. Manufacturers reportedly remain well covered through the remainder of the crop year, but market sources suggest they are exploring further coverage from both the 2025/26 and 2026/27 crops.
Image source: Adobe
Written by Nick Moss