Key Takeaways
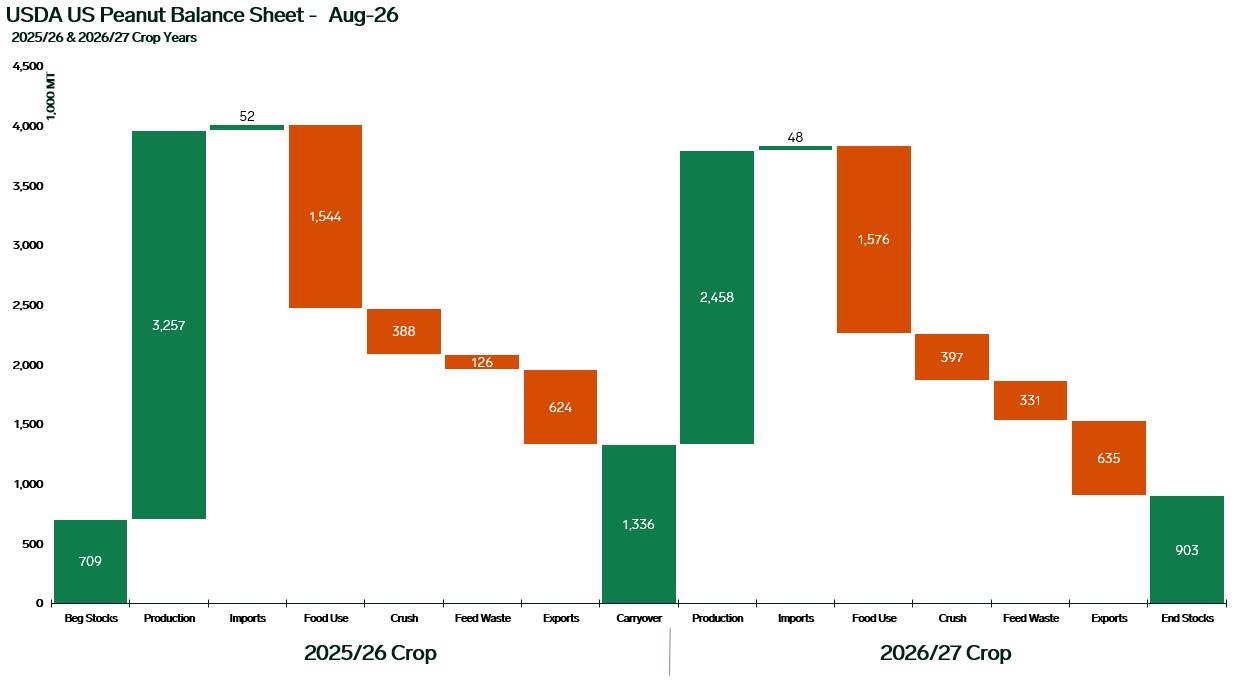
- 2025/26 ending stocks rise 51k MT to 1.336 million MT, driven primarily by a further 85k MT reduction in feed waste to 126k MT.
- 2026/27 first official production estimate places output at 2.458 million MT, down 25% year-over-year, as harvested area falls to 1.370 million acres (554k hectares).
- Elevated carryover nearly offsets the production cut; 2026/27 ending stocks edge up to 903k MT, though the balance sheet remains 32% tighter than the current year.
Each month, the US Department of Agriculture (USDA) and the World Agricultural Outlook Board (WAOB) publish production, supply, and demand estimates for a wide variety of commodities, including peanuts. These figures represent a country-by-country, year-by-year balance sheet for each commodity. For US peanuts, the crop year runs from Aug. 1 through July 31. The USDA commonly makes adjustments to estimates for multiple crop years, including forward-looking years. The USDA/NASS Crop Production report, released August 12, provided the first official in-season estimates of 2026/27 yield and production based on crop conditions as of August 1, and further revised planted and harvested acreage below prior projections. This report anchors the August 2026 balance sheet.
2025/26 Crop
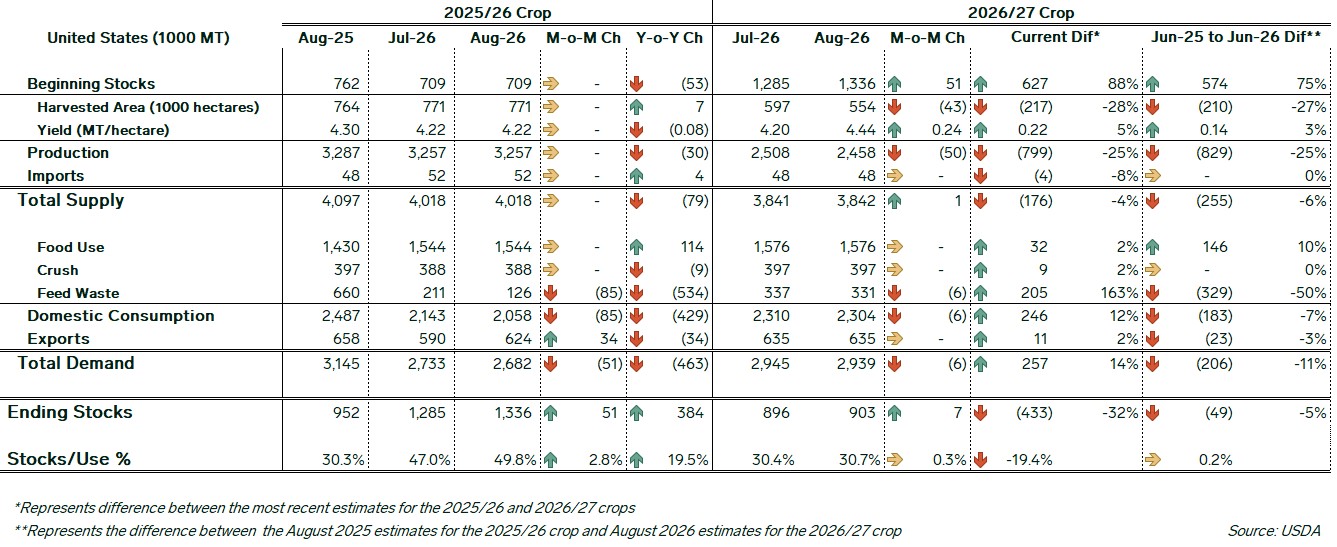
The August 2026 update brought no revisions to 2025/26 production estimates. Harvested area holds at 771k hectares (approximately 1.906 million acres), yield remains at 4.22 MT per hectare, and total production is unchanged at 3.257 million MT. Imports were also unchanged at 52k MT, leaving total supply steady at 4.018 million MT.
On the demand side, food use and crush were both unchanged at 1.544 million MT and 388k MT, respectively. Feed waste was reduced a further 85k MT to 126k MT. Exports were revised upward by 34k MT to 624k MT. Total demand declined 51k MT to 2.682 million MT.
Ending stocks rose 51k MT to 1.336 million MT, with the stocks-to-use ratio increasing 2.8 percentage points to 49.8%.
The feed waste category has continued its prolonged downward revision trajectory through the 2025/26 marketing year. From the August 2025 WASDE estimate of 660k MT, the figure has now been revised downward by a cumulative 534k MT to 126k MT — an 81% reduction over the course of the current marketing year. By comparison, the 2024/25 marketing year saw approximately 300k MT added to the feed waste category over its full revision cycle, underscoring the exceptional scale and direction of this year’s adjustments.
Market sources suggest that volatility in the feed waste/seed and residual category across the past two marketing years may have understated 2025/26 beginning stocks, with some volumes from 2024/25 carryover potentially redistributed through subsequent revisions rather than fully captured in the opening balance sheet. The concurrent and substantial upward revision to food use — now 114k MT above the August 2025 estimate at 1.544 million MT — has similarly prompted discussion about whether a portion of the balance sheet adjustments reflects a reclassification of volumes within the demand side rather than genuine changes in underlying consumption.
Market participants note, however, that current market behavior broadly aligns with where the balance sheet now stands, suggesting that while the composition of the category remains a source of uncertainty, the aggregate picture is broadly consistent with observed conditions.
2026/27 Crop
The August 2026 balance sheet incorporates the findings of the August 12 Crop Production report, which delivered the first official production estimate for the 2026/27 crop year. Harvested area was reduced by 43k hectares to 554k hectares (approximately 1.370 million acres) — a 7% reduction from the July estimate of 597k hectares and 28% below the 2025/26 harvested area of 771k hectares. Planted area is currently estimated at approximately 576k hectares (approximately 1.425 million acres), down 27% from the prior year. The implied harvest rate of approximately 96% remains consistent with recent historical norms.
Yield was revised upward by 0.24 MT per hectare to 4.44 MT per hectare, above both the initial 2026/27 projection of 4.20 MT per hectare embedded in the May through July balance sheets and above the current 2025/26 yield estimate of 4.22 MT per hectare. The net impact of the area reduction and yield increase was a production decline of 50k MT to 2.458 million MT — 799k MT (25%) below the current 2025/26 estimate, consistent with the approximately 25% year-over-year reduction cited in the Crop Production report.
Beginning stocks were revised up 51k MT to 1.336 million MT, flowing directly from the upward revision to 2025/26 ending stocks. Beginning stocks for 2026/27 now stand 627k MT (88%) above the stocks that opened the current 2025/26 marketing year — an elevated carryover that continues to provide a meaningful supply cushion entering the new crop year. Market sources note, however, that the magnitude of this comparison may be somewhat overstated in practical terms: to the extent that 2025/26 beginning stocks were understated due to feed waste and residual category volatility in the prior marketing year, the apparent scale of the carryover build may not fully reflect realized inventory levels in the market. Total supply for 2026/27 rose 1k MT to 3.842 million MT, effectively unchanged.
On the demand side, feed waste was trimmed 6k MT to 331k MT. Food use, crush, and exports were unchanged at 1.576 million MT, 397k MT, and 635k MT, respectively. Total demand declined 6k MT to 2.939 million MT.
With supply rising 1k MT and demand declining 6k MT, ending stocks for 2026/27 rose 7k MT to 903k MT. The stocks-to-use ratio increased 0.3 percentage points to 30.7%.
Relative to the current 2025/26 crop, 2026/27 ending stocks are projected 433k MT (32%) lower, and the stocks-to-use ratio sits 19.4 percentage points below the current-year estimate — a substantial differential driven by the scale of the new-crop production reduction against the elevated old-crop carryout. In a broader context, comparing current 2026/27 estimates to where the 2025/26 balance sheet stood at the corresponding point a year ago provides useful perspective: despite a 829k MT (25%) reduction in projected production and a 255k MT (6%) decline in total supply, 2026/27 ending stocks are currently projected only 49k MT (5%) below where 2025/26 ending stocks were estimated at the opening of the current marketing year, with the stocks-to-use ratio for 2026/27 in line with the year-ago 2025/26 opening estimate. This convergence reflects how substantially the elevated 2025/26 carryover has buffered the impact of a materially smaller new crop.
Outlook
The August 2026 balance sheet formalizes the new-crop supply reduction that market participants had broadly anticipated. The August 12 Crop Production report placed planted area at approximately 1.425 million acres — down 7% from the prior estimate and 27% below 2025 — and harvested area at 1.370 million acres, down 28% year-over-year. With production now projected at 2.458 million MT (5.42 billion pounds), new-crop output is estimated 25% below the prior year. These remain projections based on conditions as of August 1; final realized values will depend on how the remainder of the growing season unfolds.
The yield estimate has drawn measured scrutiny from market participants. The USDA’s initial in-season forecast of 3,956 pounds per acre is above both the prior year’s realized yield and the trend-based projection embedded in earlier balance sheet updates. Market sources have indicated the estimate may be optimistic given conditions experienced to date and weather risks ahead. Market participants note that the critical pod set and filling stages lie largely ahead, and that conditions through those phases will be important determinants of whether the current yield projection is achieved or revised in subsequent updates. Given the scale of the acreage reduction already embedded in the balance sheet, even modest yield underperformance relative to the USDA’s current estimate could meaningfully reduce projected production and further tighten the forward supply outlook.
Market sources continue to report old-crop supplies as readily available, a characterization broadly consistent with the August update’s projected 2025/26 ending stocks of 1.336 million MT and a stocks-to-use ratio of 49.8%. Sellers have nonetheless maintained firm pricing, citing forward-looking supply uncertainty. Market participants note, however, that while the aggregate balance sheet remains supply-heavy, available old-crop inventory does not uniformly meet all buyer specifications. Factors including quality levels and size profiles mean that not all balance sheet supply translates directly to available supply against specific buyer requirements. Quality risks can also intensify with extended storage periods, adding a further layer of complexity to the practical availability picture. For new-crop, growers have shown limited selling interest, creating significant uncertainty for shellers regarding acquisition costs and margins. New-crop offers have been limited and are expected to remain so in the near term.
The mid-September balance sheet update will be the next key data point. That update may incorporate revised yield assumptions based on continued crop progress assessments and could also reflect additional adjustments to acreage estimates as the season advances. Should conditions deteriorate through pod filling stages, further downward pressure on yield and production projections remains possible; conversely, favorable late-season weather could support the current yield assumption and stabilize the supply outlook. With 2026/27 ending stocks projected at 903k MT and a stocks-to-use ratio of 30.7%, the balance sheet is meaningfully tighter than the current marketing year — though the substantial carryover from 2025/26 continues to provide a near-term buffer, and the extent to which late-season crop development affects that buffer will remain a key focus for market participants through the end of the growing season.
Find more of our nut market coverage information here.
Written by Nick Moss