
Cod prices today
Cod prices are set in the north. Barents Sea quotas and Norwegian landings drive supply, while salmon and other whitefish compete for demand. Expana assesses Atlantic cod fillet into the US and frozen Norwegian cod, along with cod market forecasts and intelligence.
Importers, processors and foodservice buyers use our cod data to follow quota news and benchmark what they pay.
Cod price chart
| Date | Price (USD/lb) | MoM % | QoQ % | YoY |
|---|---|---|---|---|
|
Unlock
Unlock our cod prices and future forecasts.
|
||||
| 8.45 | → 0.0% | → 0.0% | — | |
| 8.45 | → 0.0% | → 0.0% | — | |
| 8.45 | → 0.0% | → 0.0% | — | |
| 8.45 | → 0.0% | → 0.0% | — | |
| 8.45 | → 0.0% | → 0.0% | — | |
| 8.45 | → 0.0% | → 0.0% | — | |
| 8.45 | → 0.0% | → 0.0% | — | |
| 8.45 | → 0.0% | → 0.0% | — | |
| 8.45 | → 0.0% | → 0.0% | — | |
| 8.45 | → 0.0% | → 0.0% | — | |
| 8.45 | → 0.0% | → 0.0% | — | |
| 8.45 | → 0.0% | → 0.0% | — | |
| 8.45 | → 0.0% | → 0.0% | — | |
| 8.45 | → 0.0% | → 0.0% | — | |
| 8.45 | → 0.0% | → 0.0% | — | |
| 8.45 | → 0.0% | → 0.0% | — | |
| 8.45 | → 0.0% | ↑ 7.6% | — | |
| 8.45 | → 0.0% | ↑ 7.6% | — | |
| 8.45 | → 0.0% | ↑ 7.6% | — | |
| 8.45 | → 0.0% | ↑ 7.6% | — | |
| 8.45 | → 0.0% | ↑ 7.6% | — | |
| 8.45 | → 0.0% | ↑ 7.6% | — | |
| 8.45 | → 0.0% | ↑ 7.6% | — | |
| 8.45 | → 0.0% | ↑ 7.6% | — | |
| 8.45 | → 0.0% | ↑ 9.7% | — | |
| 8.45 | → 0.0% | ↑ 9.7% | — | |
| 8.45 | → 0.0% | ↑ 11.9% | — | |
| 8.45 | → 0.0% | ↑ 11.9% | — | |
| 8.45 | → 0.0% | ↑ 11.9% | — | |
| 8.45 | → 0.0% | ↑ 14.2% | — | |
| 8.45 | → 0.0% | ↑ 14.2% | — | |
| 8.45 | → 0.0% | ↑ 14.2% | — | |
| 8.45 | → 0.0% | ↑ 14.2% | — | |
| 8.45 | → 0.0% | ↑ 14.2% | — | |
| 8.45 | ↑ 7.6% | ↑ 14.2% | — | |
| 8.45 | ↑ 7.6% | ↑ 14.2% | — | |
| 8.45 | ↑ 7.6% | ↑ 14.2% | — | |
| 8.45 | ↑ 7.6% | ↑ 14.2% | — | |
| 8.45 | ↑ 7.6% | ↑ 14.2% | — | |
| 8.45 | ↑ 7.6% | ↑ 14.2% | — | |
| 8.45 | ↑ 7.6% | ↑ 14.2% | — | |
| 8.45 | ↑ 7.6% | ↑ 14.2% | — | |
| 8.45 | ↑ 9.7% | ↑ 14.2% | — | |
| 7.85 | ↑ 4.0% | ↑ 6.1% | — | |
| 7.85 | ↑ 4.0% | ↑ 6.1% | — | |
| 7.85 | ↑ 4.0% | ↑ 6.1% | — | |
| 7.85 | ↑ 6.1% | ↑ 6.1% | — | |
| 7.85 | ↑ 6.1% | ↑ 6.1% | — | |
| 7.85 | ↑ 6.1% | ↑ 6.1% | — | |
| 7.85 | ↑ 6.1% | ↑ 6.1% | — | |
| 7.7 | ↑ 4.1% | ↑ 5.5% | — | |
| 7.55 | ↑ 2.0% | — | — | |
| 7.55 | ↑ 2.0% | — | — | |
| 7.55 | ↑ 2.0% | — | — | |
| 7.55 | ↑ 2.0% | — | — | |
| 7.4 | → 0.0% | — | — | |
| 7.4 | → 0.0% | — | — | |
| 7.4 | → 0.0% | — | — | |
| 7.4 | → 0.0% | — | — | |
| 7.4 | → 0.0% | — | — | |
| 7.4 | → 0.0% | — | — | |
| 7.4 | → 0.0% | — | — | |
| 7.4 | → 0.0% | — | — | |
| 7.4 | → 0.0% | — | — | |
| 7.4 | → 0.0% | — | — | |
| 7.4 | → 0.0% | — | — | |
| 7.4 | → 0.0% | — | — | |
| 7.4 | → 0.0% | — | — | |
| 7.4 | — | — | — | |
| 7.4 | — | — | — | |
| 7.4 | — | — | — | |
| 7.4 | — | — | — | |
| 7.4 | — | — | — | |
| 7.4 | — | — | — | |
| 7.4 | — | — | — | |
| 7.4 | — | — | — | |
| 7.4 | — | — | — | |
| 7.3 | — | — | — | |
Expana: IOSCO-assured cod prices from quota to plate
More than 180 cod series feed our coverage, from US Atlantic cod fillet to frozen cod delivered into Norway and auction prices in Iceland and Denmark. Specialist reporters build each assessment from market indications. The IQF Atlantic cod fillet (China, 4-8 oz) benchmark is IOSCO assured, giving the market an independently reviewed reference.
Cod coverage is led by Janice Schreiber, Managing Editor, Seafood. Explore related coverage on our seafood, salmon prices and shrimp prices pages.
Cod benchmarks across markets
Over 180 cod series, from US Atlantic cod fillet and frozen cod delivered into Norway to auction, export and wholesale prices in Iceland, Denmark, Spain and France.
Core cod forecast
A Core forecast on frozen cod delivered into Norway, with price targets, bands and a buyer hedging indicator, plus forecasts on Danish auction and Norwegian export prices.
Cut, size and origin coverage
Skinless, boneless fillet at 4-8 oz, frozen gutted headless cod at 1-2.5kg, Atlantic cod by size at auction, and fresh and frozen Norwegian export prices.
Quota and supply tracking
Barents Sea quota decisions, Norwegian landings, US groundfish imports and the price gap to salmon.
Price history
Cod price history with month, quarter and year-on-year change.
Market commentary
News and analysis on Barents Sea quotas, Norwegian landings and whitefish demand.
Our cod coverage includes:
Cod price forecast
Cod prices are shaped by Barents Sea quotas, Norwegian landings, seasonal patterns and competition from other whitefish. Expana’s cod forecast covers frozen cod delivered into Norway (gutted, headless, 1-2.5kg), priced in NOK per kg. It shows where prices may move next and how far they sit from fair value.
- Price targets, forecast bands and a buyer hedging indicator.
- Near-term signals from landings, quota news and seasonal lows.
- Signals on whether prices sit above fair value, including the premium of Norwegian cod to Norwegian salmon.
- The risk of buyers switching when cod is expensive relative to salmon and other whitefish.
- Commentary on what is behind each change in the cod forecast.
Forecasts are forward-looking and are not a guarantee of future prices. See the forecast disclaimer.
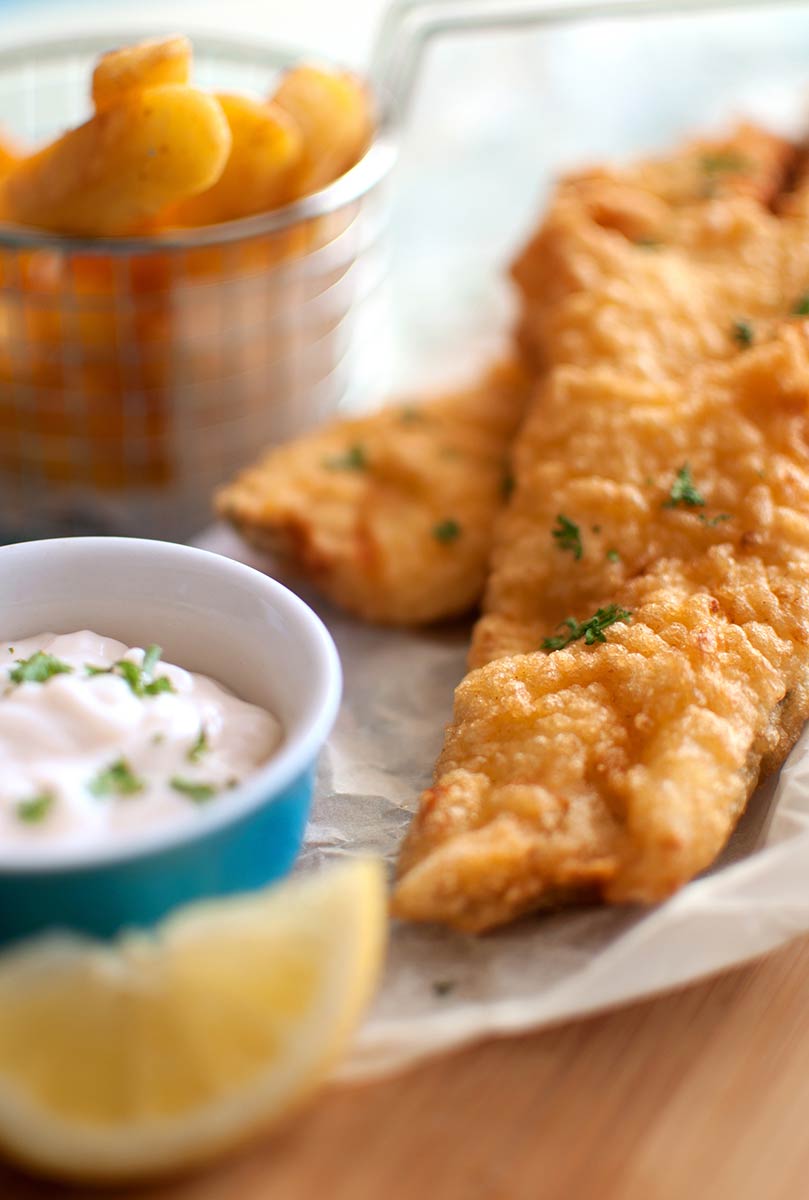
Our cod forecasting methodology
Our cod market forecasts weigh quota and landing data against demand and substitution, then test the result against price trends.
- Macroeconomic signals
We track consumer demand and substitution between cod, salmon and other whitefish. - Technical indicators
We apply MACD, RSI and moving averages to read momentum and turning points. - Fundamental analysis
We weigh quotas, landings and inventories against a fair value band, alongside seasonality.
Our IQF Atlantic cod fillet (China, 4-8 oz) benchmark is IOSCO assured. Read more about our price assessment methodology. Importers and processors can use it to plan purchases around quota and seasonal changes.

Looking for full insights on the cod market? Get a demo today.
Latest cod news and insights
Cod and whitefish analysis from our seafood team.
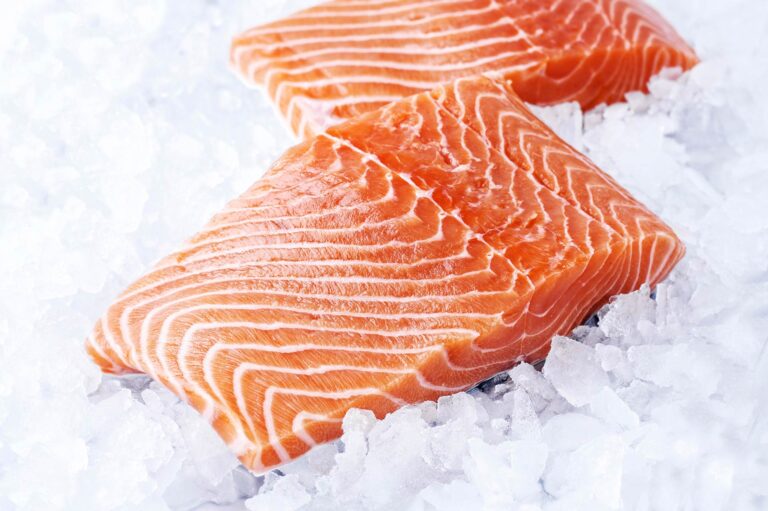
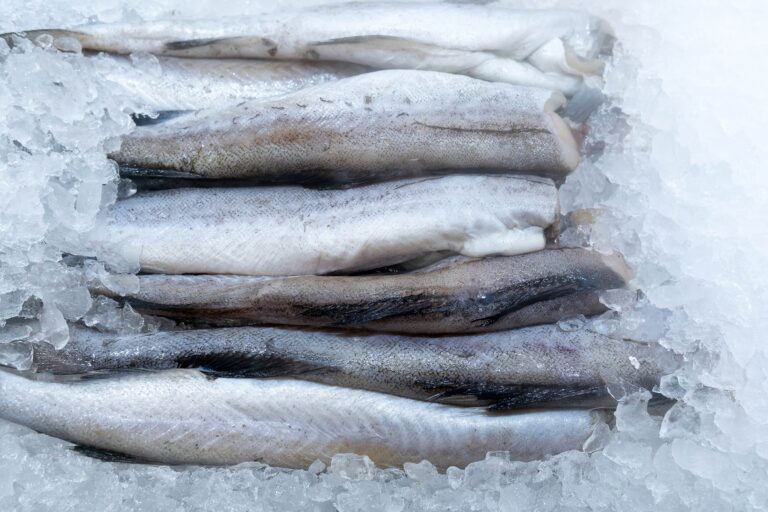






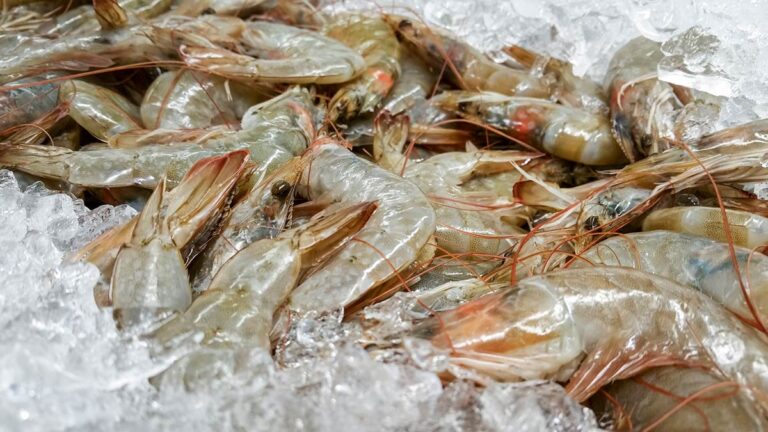

















Cod Market FAQs
What drives cod prices?
Cod prices are set by Barents Sea quotas, Norwegian landings, seasonal patterns and competition from other whitefish.
Why do cod quotas matter so much?
Quota cuts reduce the fish available while demand can stay firm, which keeps prices high until buyers switch to alternatives. Norwegian and Russian quota agreements are therefore closely watched.
What cod benchmarks does Expana cover?
Expana covers skinless, boneless Atlantic cod fillet at 4-8 oz in the US and gutted, headless frozen cod at 1-2.5kg delivered into Norway.
What factors influence cod price forecasts?
Key factors include quotas, landings, inventories, seasonality, the price gap to salmon and technical signals such as moving averages and RSI.
What is the cod price forecast?
A cod price forecast is a forward-looking view of how prices may develop over a set period. Expana’s Core forecast for frozen cod delivered into Norway provides price targets, bands and commentary. Forecasts are not a guarantee of future prices; see the forecast disclaimer.



Essential intelligence for industry professionals
Expana delivers essential intelligence to industry professionals across seafood markets, ensuring business leaders stay informed about the latest prices and industry trends, enabling them to effectively navigate disruptions, manage prices, and deliver value to their customers.